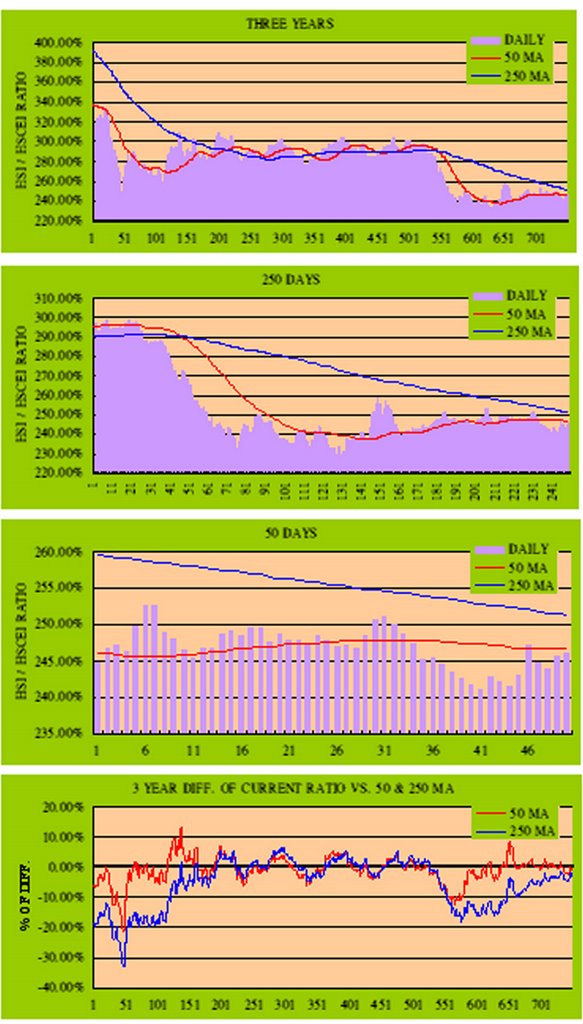
應 blog 友 Mr.P 建議,一次過列出多幅「恆 / 國指比率」圖表,由上至下分別為:
1.750天圖 (三年)
2.250 天圖
3.50 天圖
4.三年來「恆 / 國指比率」相對 50 天MA 及 250天 MA 波動率
礙於時間不足關係,日期指標暫只能按日數排列,故需要各位自行動手作加減,將來有較多空餘時間,必進一步在 Photoshop 執靚才放上 Blog。另若要放大看清楚,只需按一下圖表便可。
嘉豪從表 4 觀察所得,現在「恆 / 國指比率」正處於近三年來較中性位置,看來應耐心等候有關比率偏離 50 天MA 接近 10% 時,才著手部署反方向做有關套戥。所謂集思廣益,何況嘉豪根本從未作有關套戥式買賣,未知各方高手有否好提議?


1 則留言:
Sorry that I can only type English at work. ^_^
Thank you for the charts once again! On a first look I think the 3-year chart is interesting. It showed 2 sharp declines, which happened exactly when Hangseng Index had a long downward wave (early-2004, mid-2006).
My initial conclusion:
國指抗跌能力 > 恆指抗跌能力
P.S. more free time these 2 days? ^_^
發佈留言